In this final installment of the dashboards series (previous posts – 1, 2 and 3), let’s see what operational dashboards are, how to design them, and the scenarios when you might use them.
What are operational dashboards?
As the name indicates, operational dashboards are pretty useful tools for operations teams to monitor and proactively manage their day-to-day activities. They’re all about showing what’s happening now. The data is usually near real-time, and may cover a single day, or up to a week at maximum. They don’t contain as much historical information as strategic or analytical dashboards.
Operational dashboards are usually projected on large-screen TVs for the whole organization to view.
Operational dashboards – examples
Examples of operational dashboards include:
- A web analytics dashboard showing the number of pageviews, users, sessions, bounce rates, sign-ups, and purchases over the course of a day.
- A social media dashboard showing Facebook likes being received, tweets, followers, shares, and more.
- A manufacturing/production dashboard that reflects the number of products produced, defects observed, goods packaged, and goods shipped.
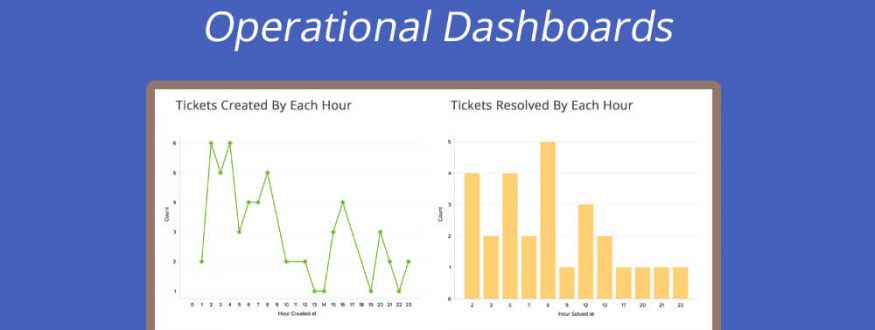
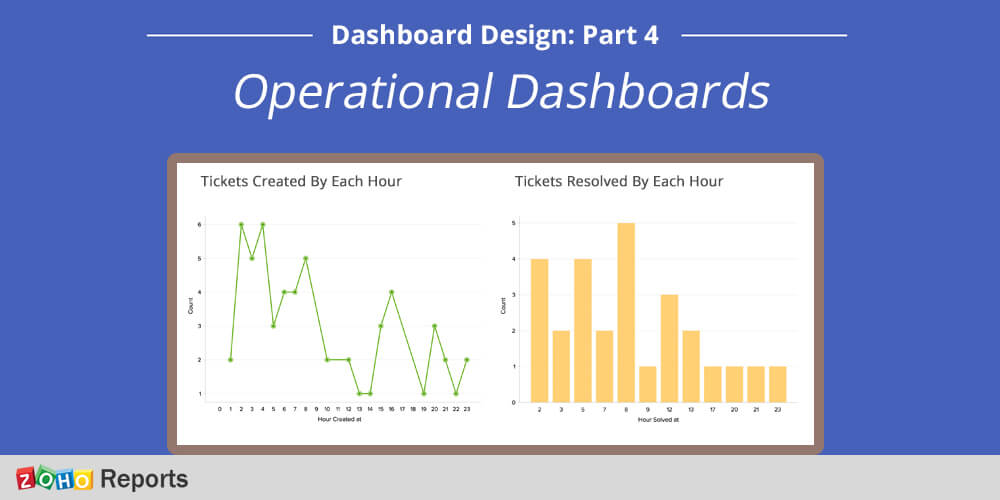
- A help desk dashboard showing the number of tickets being received by the hour, the number of tickets being closed, the ones being reopened, the number of calls being made.
Designing operational dashboards
Here are some tips for designing operational dashboards:
- Keep the data current. Since operational dashboards are all about showing things in progress, it becomes crucial to have the data as near real-time as possible.
- Set up automatic data syncing (from apps, databases, files, web feeds—wherever you’re pulling it from ) to the dashboard. This will make things a lot easier for you, compared to manually entering/updating it every few minutes or hours.
- Stick to metrics of one department or team. Because an operational dashboard is likely to be projected on a large screen TV for that particular team’s members to look at.
- Set targets (thresholds or goals) for each metric. That gives the team an idea of where they are with respect to the day’s or week’s target.
- Choose a dashboard tool that automatically refreshes when new data comes in, or at regular preset intervals. If you have to manually reload or generate the dashboard to reflect the latest numbers, it defeats the purpose.
Try constructing operational dashboards with Zoho Reports, or register for a personalized live demo.
Related links
- Dashboard design – Part 1: Types of dashboards
- Dashboard design – Part 2: Strategic dashboards
- Dashboard design – Part 3: Analytical dashboards